Science-based carbon accounting software
Understand your entire organizational carbon footprint across your value chain. Carbon Direct takes the complexities out of carbon accounting by pairing scientific expertise with our proprietary carbon accounting software, delivering meaningful insights to drive climate action with confidence.
Understand your entire organizational carbon footprint across your value chain. Carbon Direct takes the complexities out of carbon accounting by pairing scientific expertise with our proprietary carbon accounting software, delivering meaningful insights to drive climate action with confidence.
Understand your entire organizational carbon footprint across your value chain. Carbon Direct takes the complexities out of carbon accounting by pairing scientific expertise with our proprietary carbon accounting software, delivering meaningful insights to drive climate action with confidence.

Why is it important to get your carbon footprint right?
The net-zero transition is transforming how businesses operate, creating opportunities for innovation, efficiency, and growth. Understanding your organization’s carbon footprint provides a clear picture of your climate impact to identify areas to prioritize decarbonization efforts, which enables informed decisions about transitioning to net-zero. As the first step on the net-zero journey, getting the right approach to carbon accounting is critical. Poor data can lead to poor decision-making and companies can miss opportunities to deliver on their climate goals. A science-based carbon footprint is the foundation for taking effective action to reduce emissions and move toward a more sustainable future.
Align with established and evolving policies and frameworks
Align with common frameworks including CDP, Science Based Targets initiative (SBTi), and the Greenhouse Gas Protocol. Looking for more information about which policies are relevant to your organization?
Stay up to date with the latest global policies and requirements via our Climate Policy Navigator ->
Drive growth through science-based carbon accounting
Customers and investors increasingly prioritize working with organizations on the path to net-zero. Science-based carbon accounting makes it easier to communicate climate progress to customers and investors. Good carbon accounting data also unlocks new opportunities for supply chain efficiencies, climate finance, and product innovation.
Learn how The Russell Family Foundation is driving capital to sustainable organizations ->

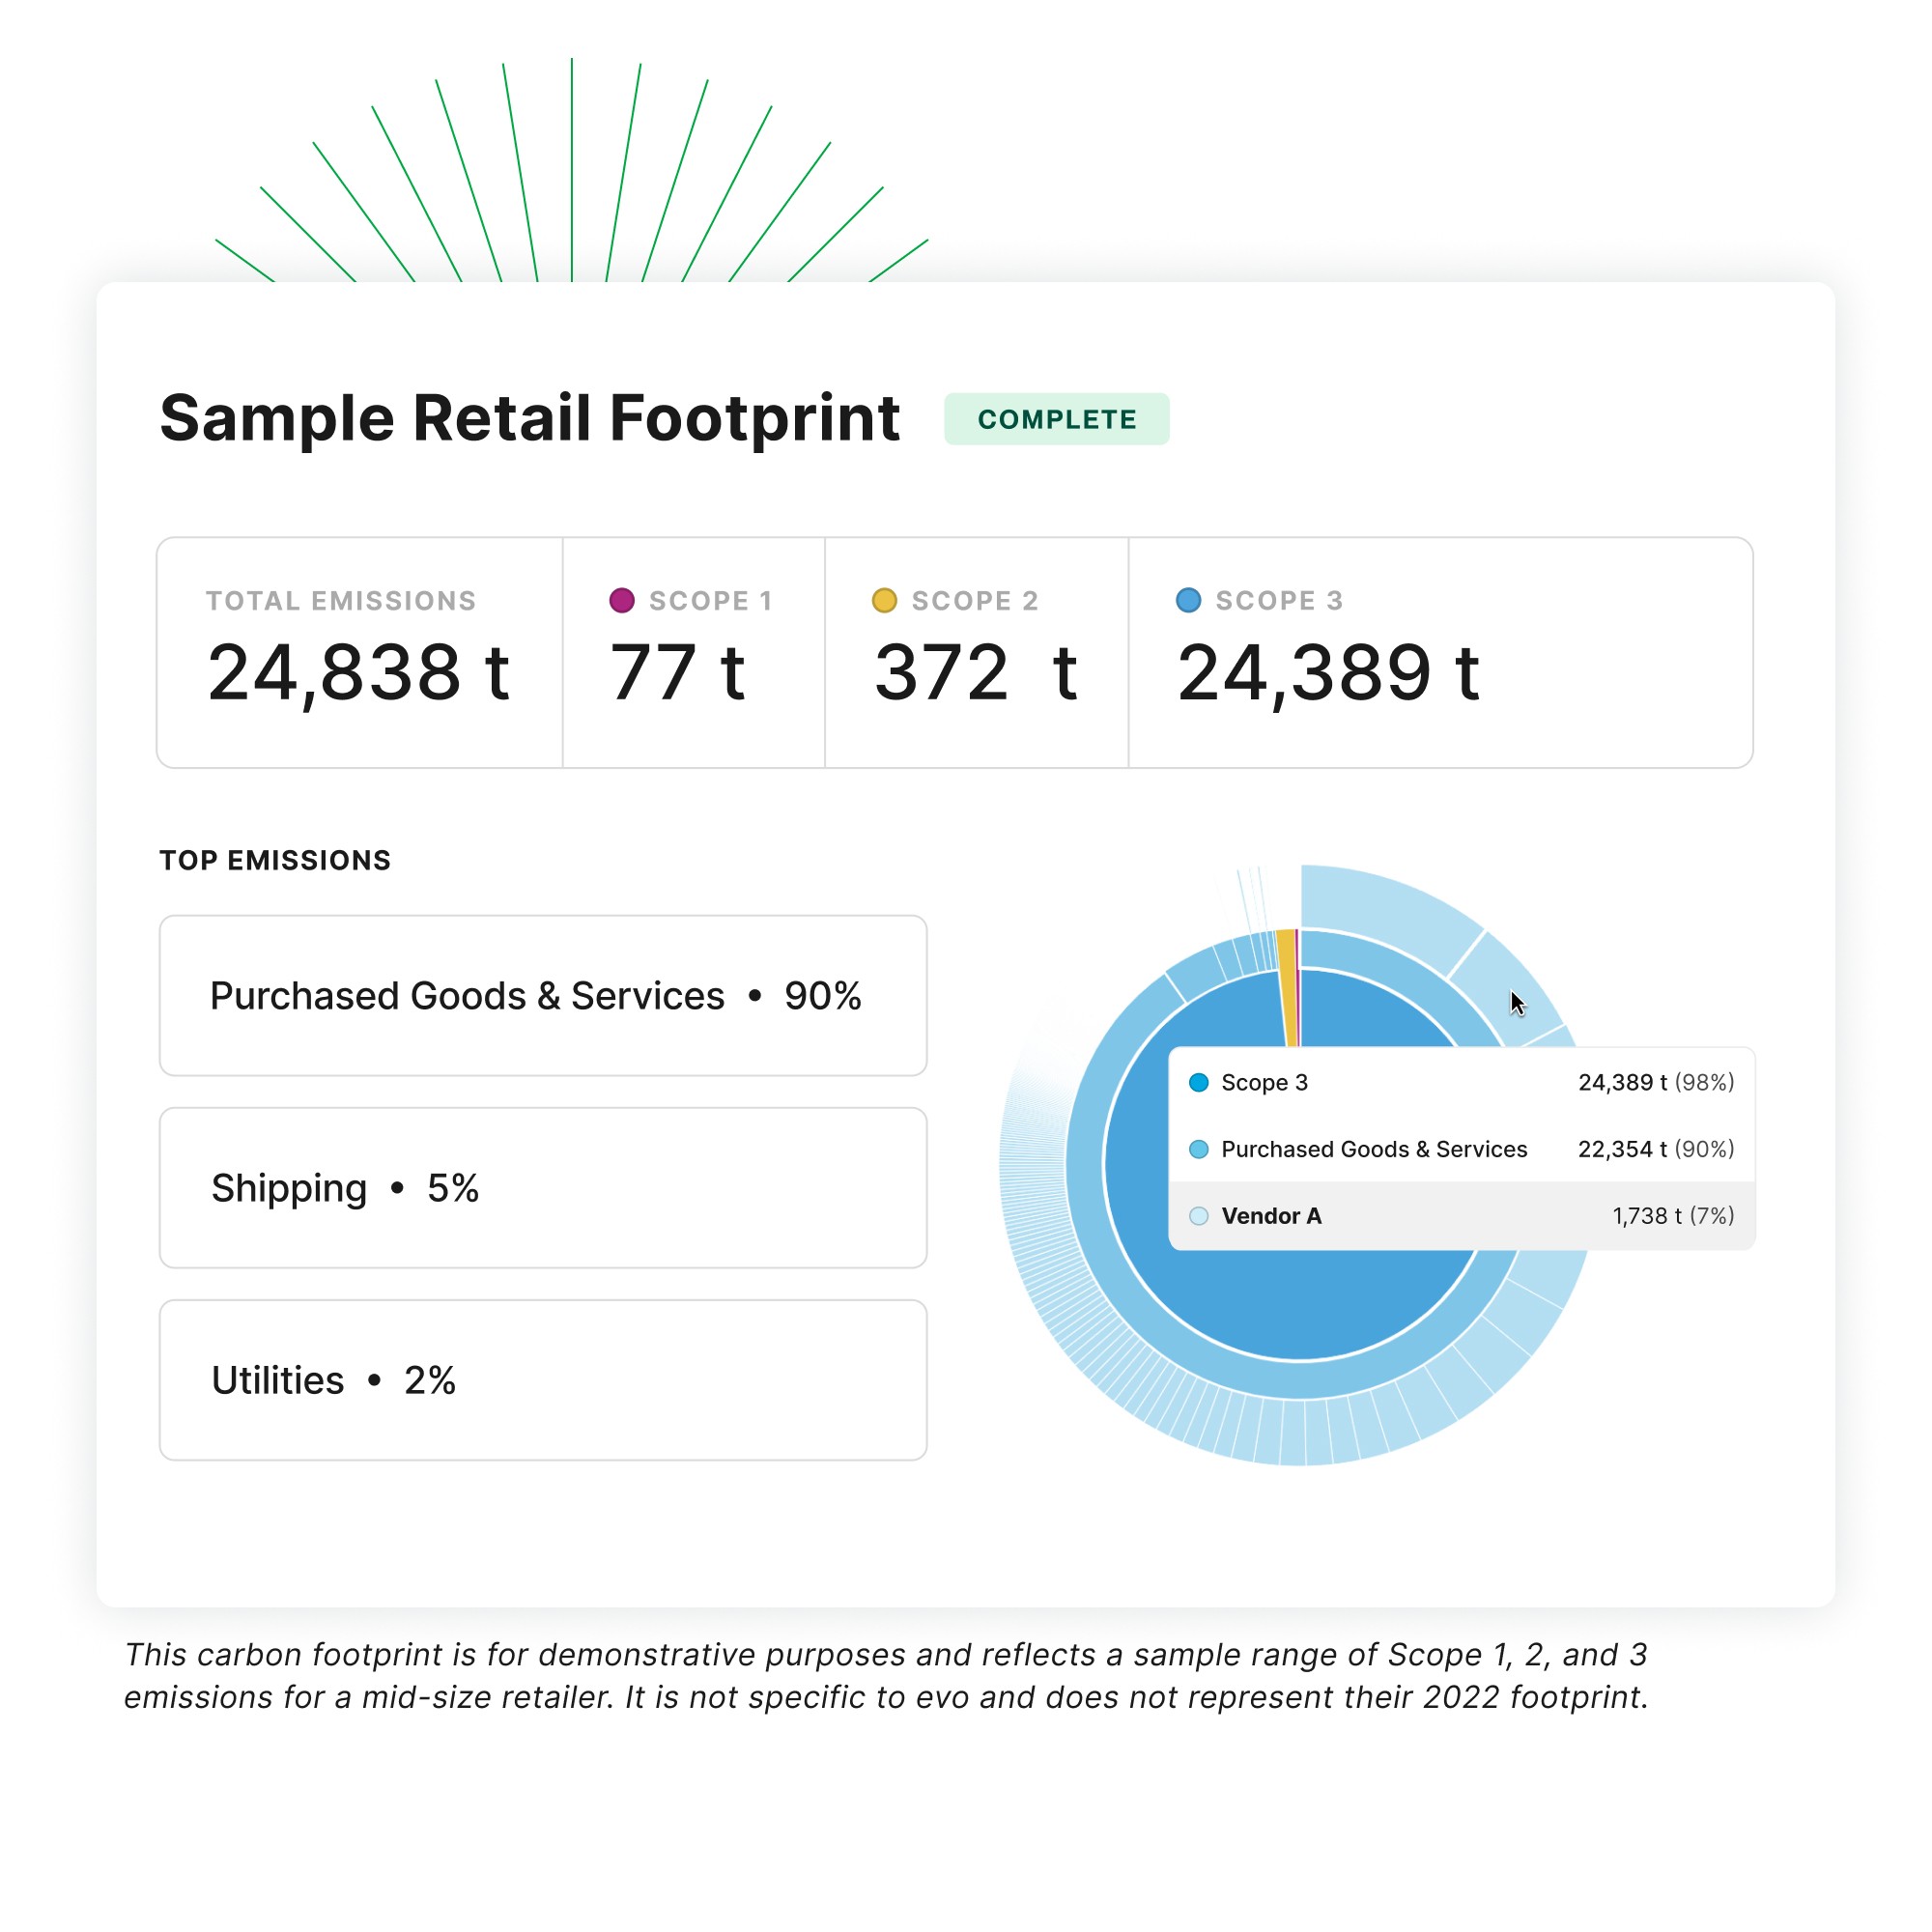
Maximize impact by prioritizing the highest emitting activities
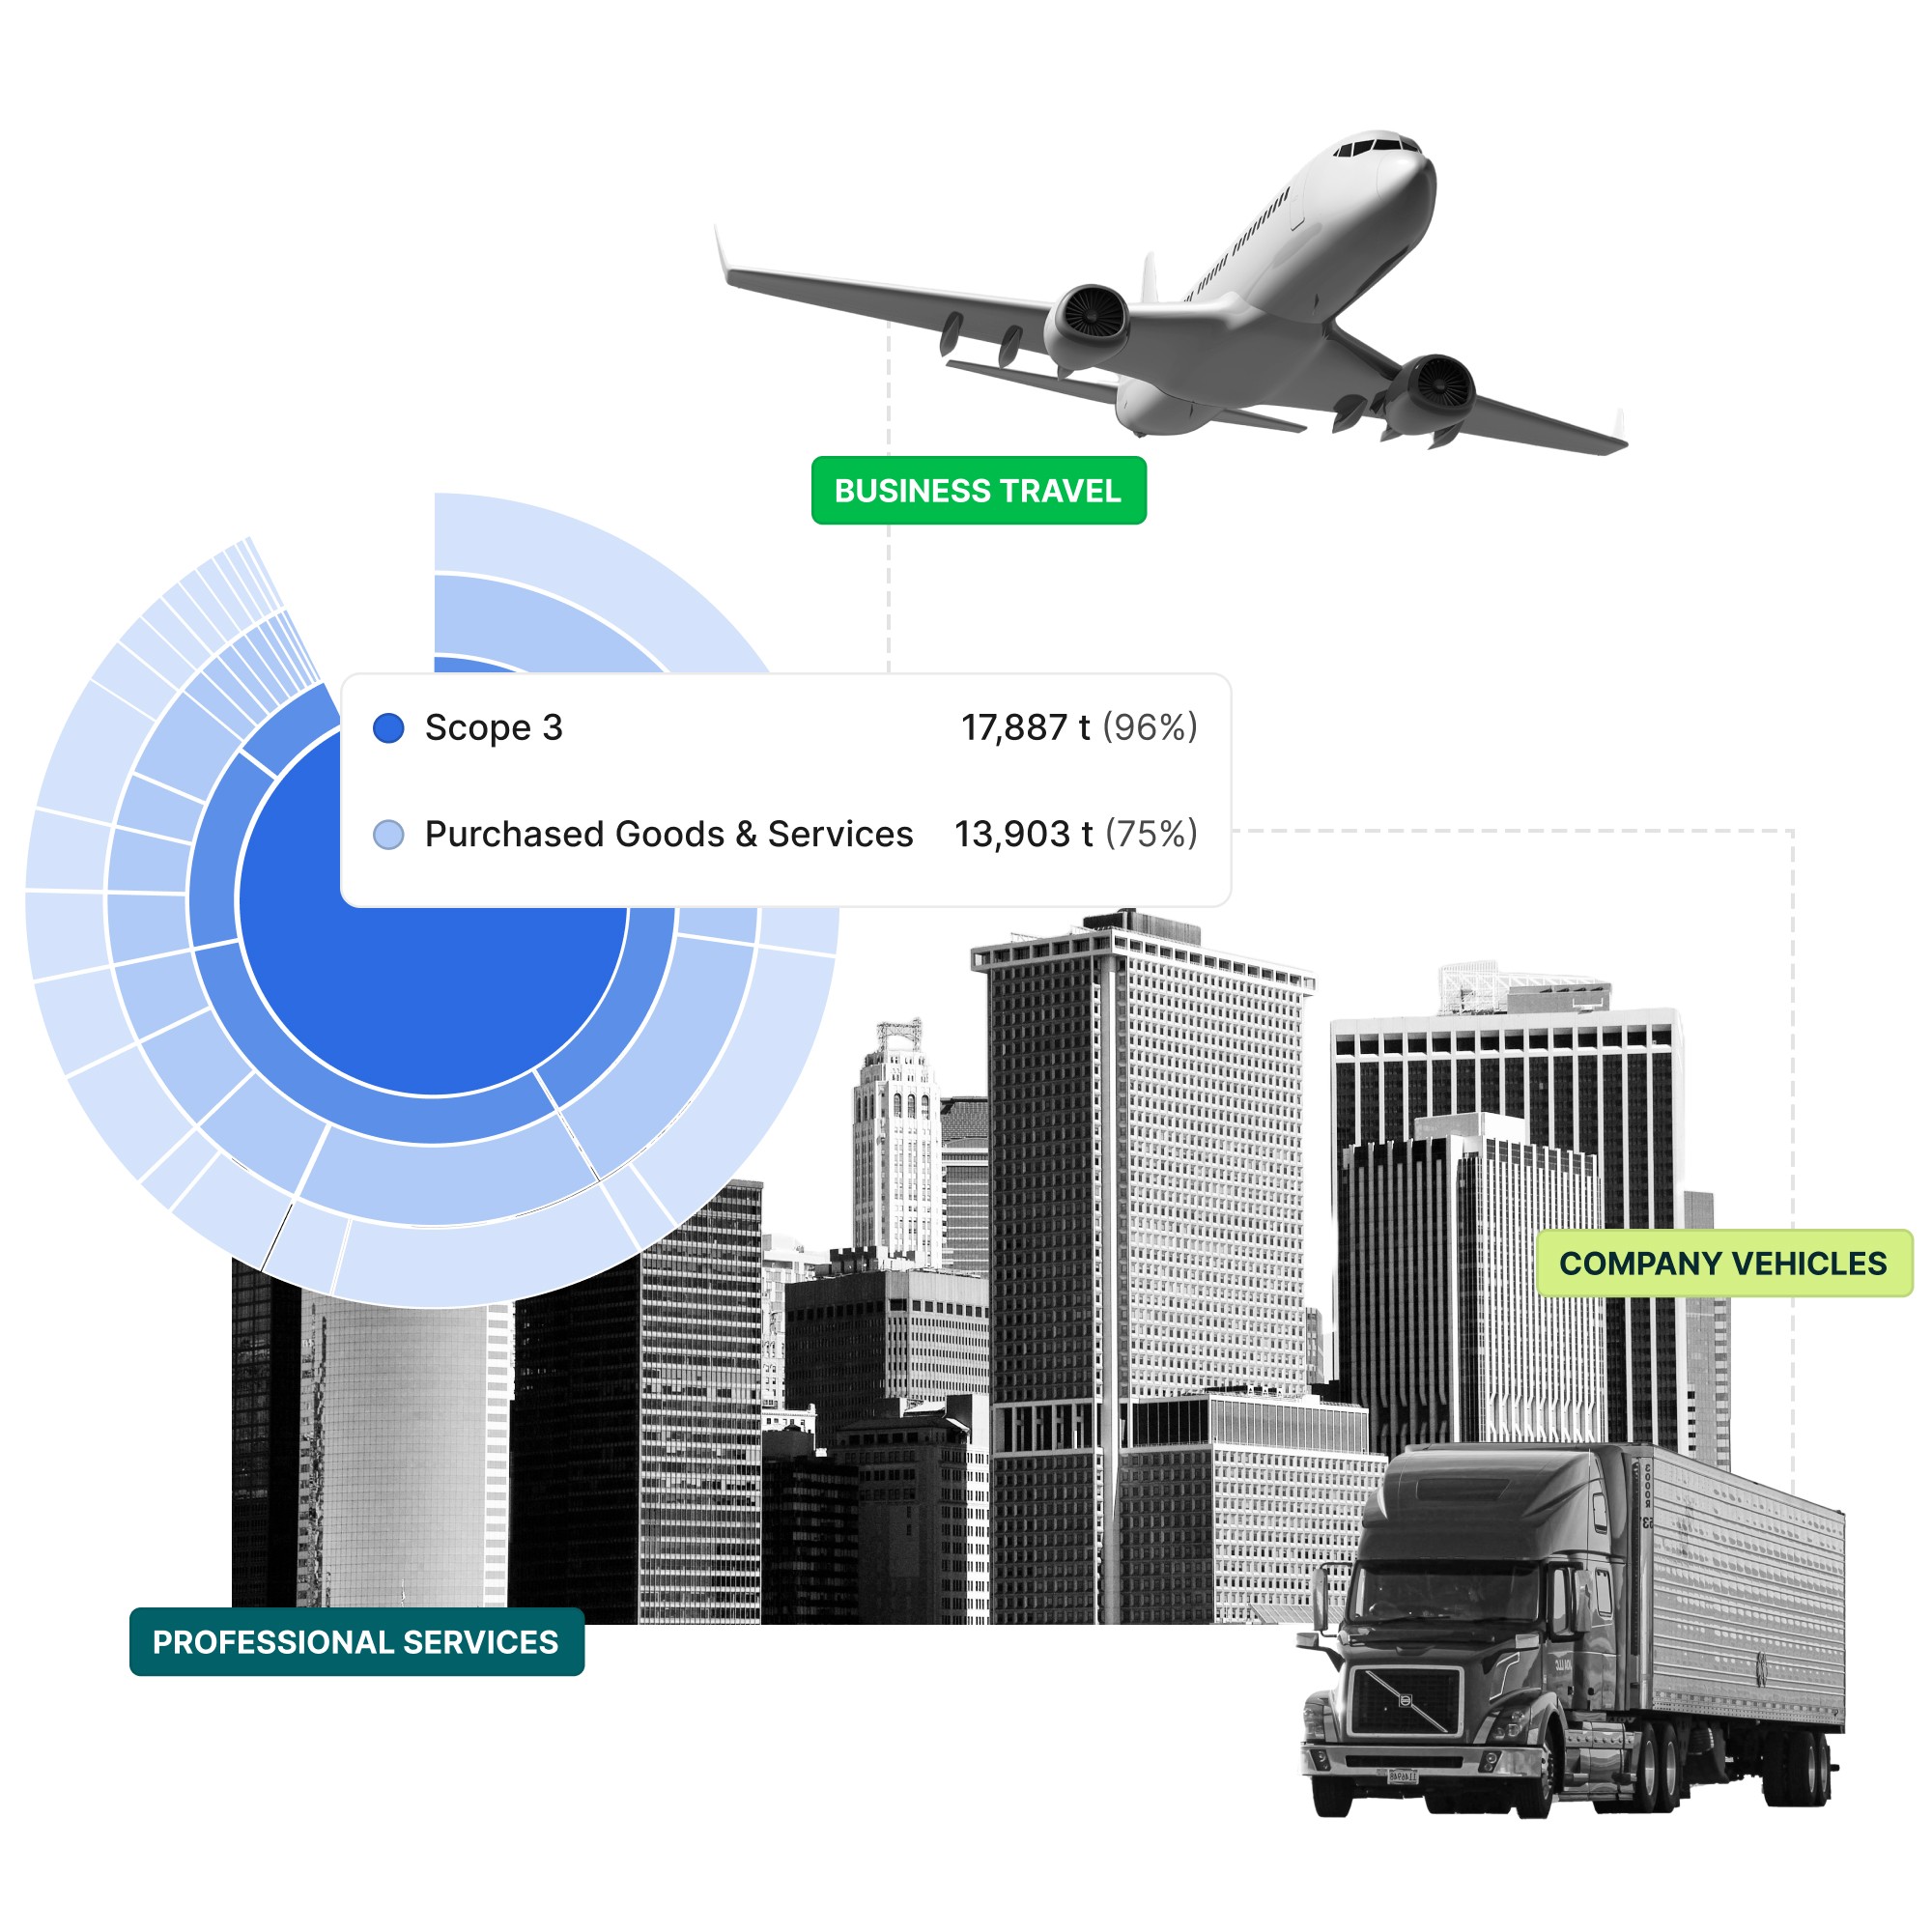
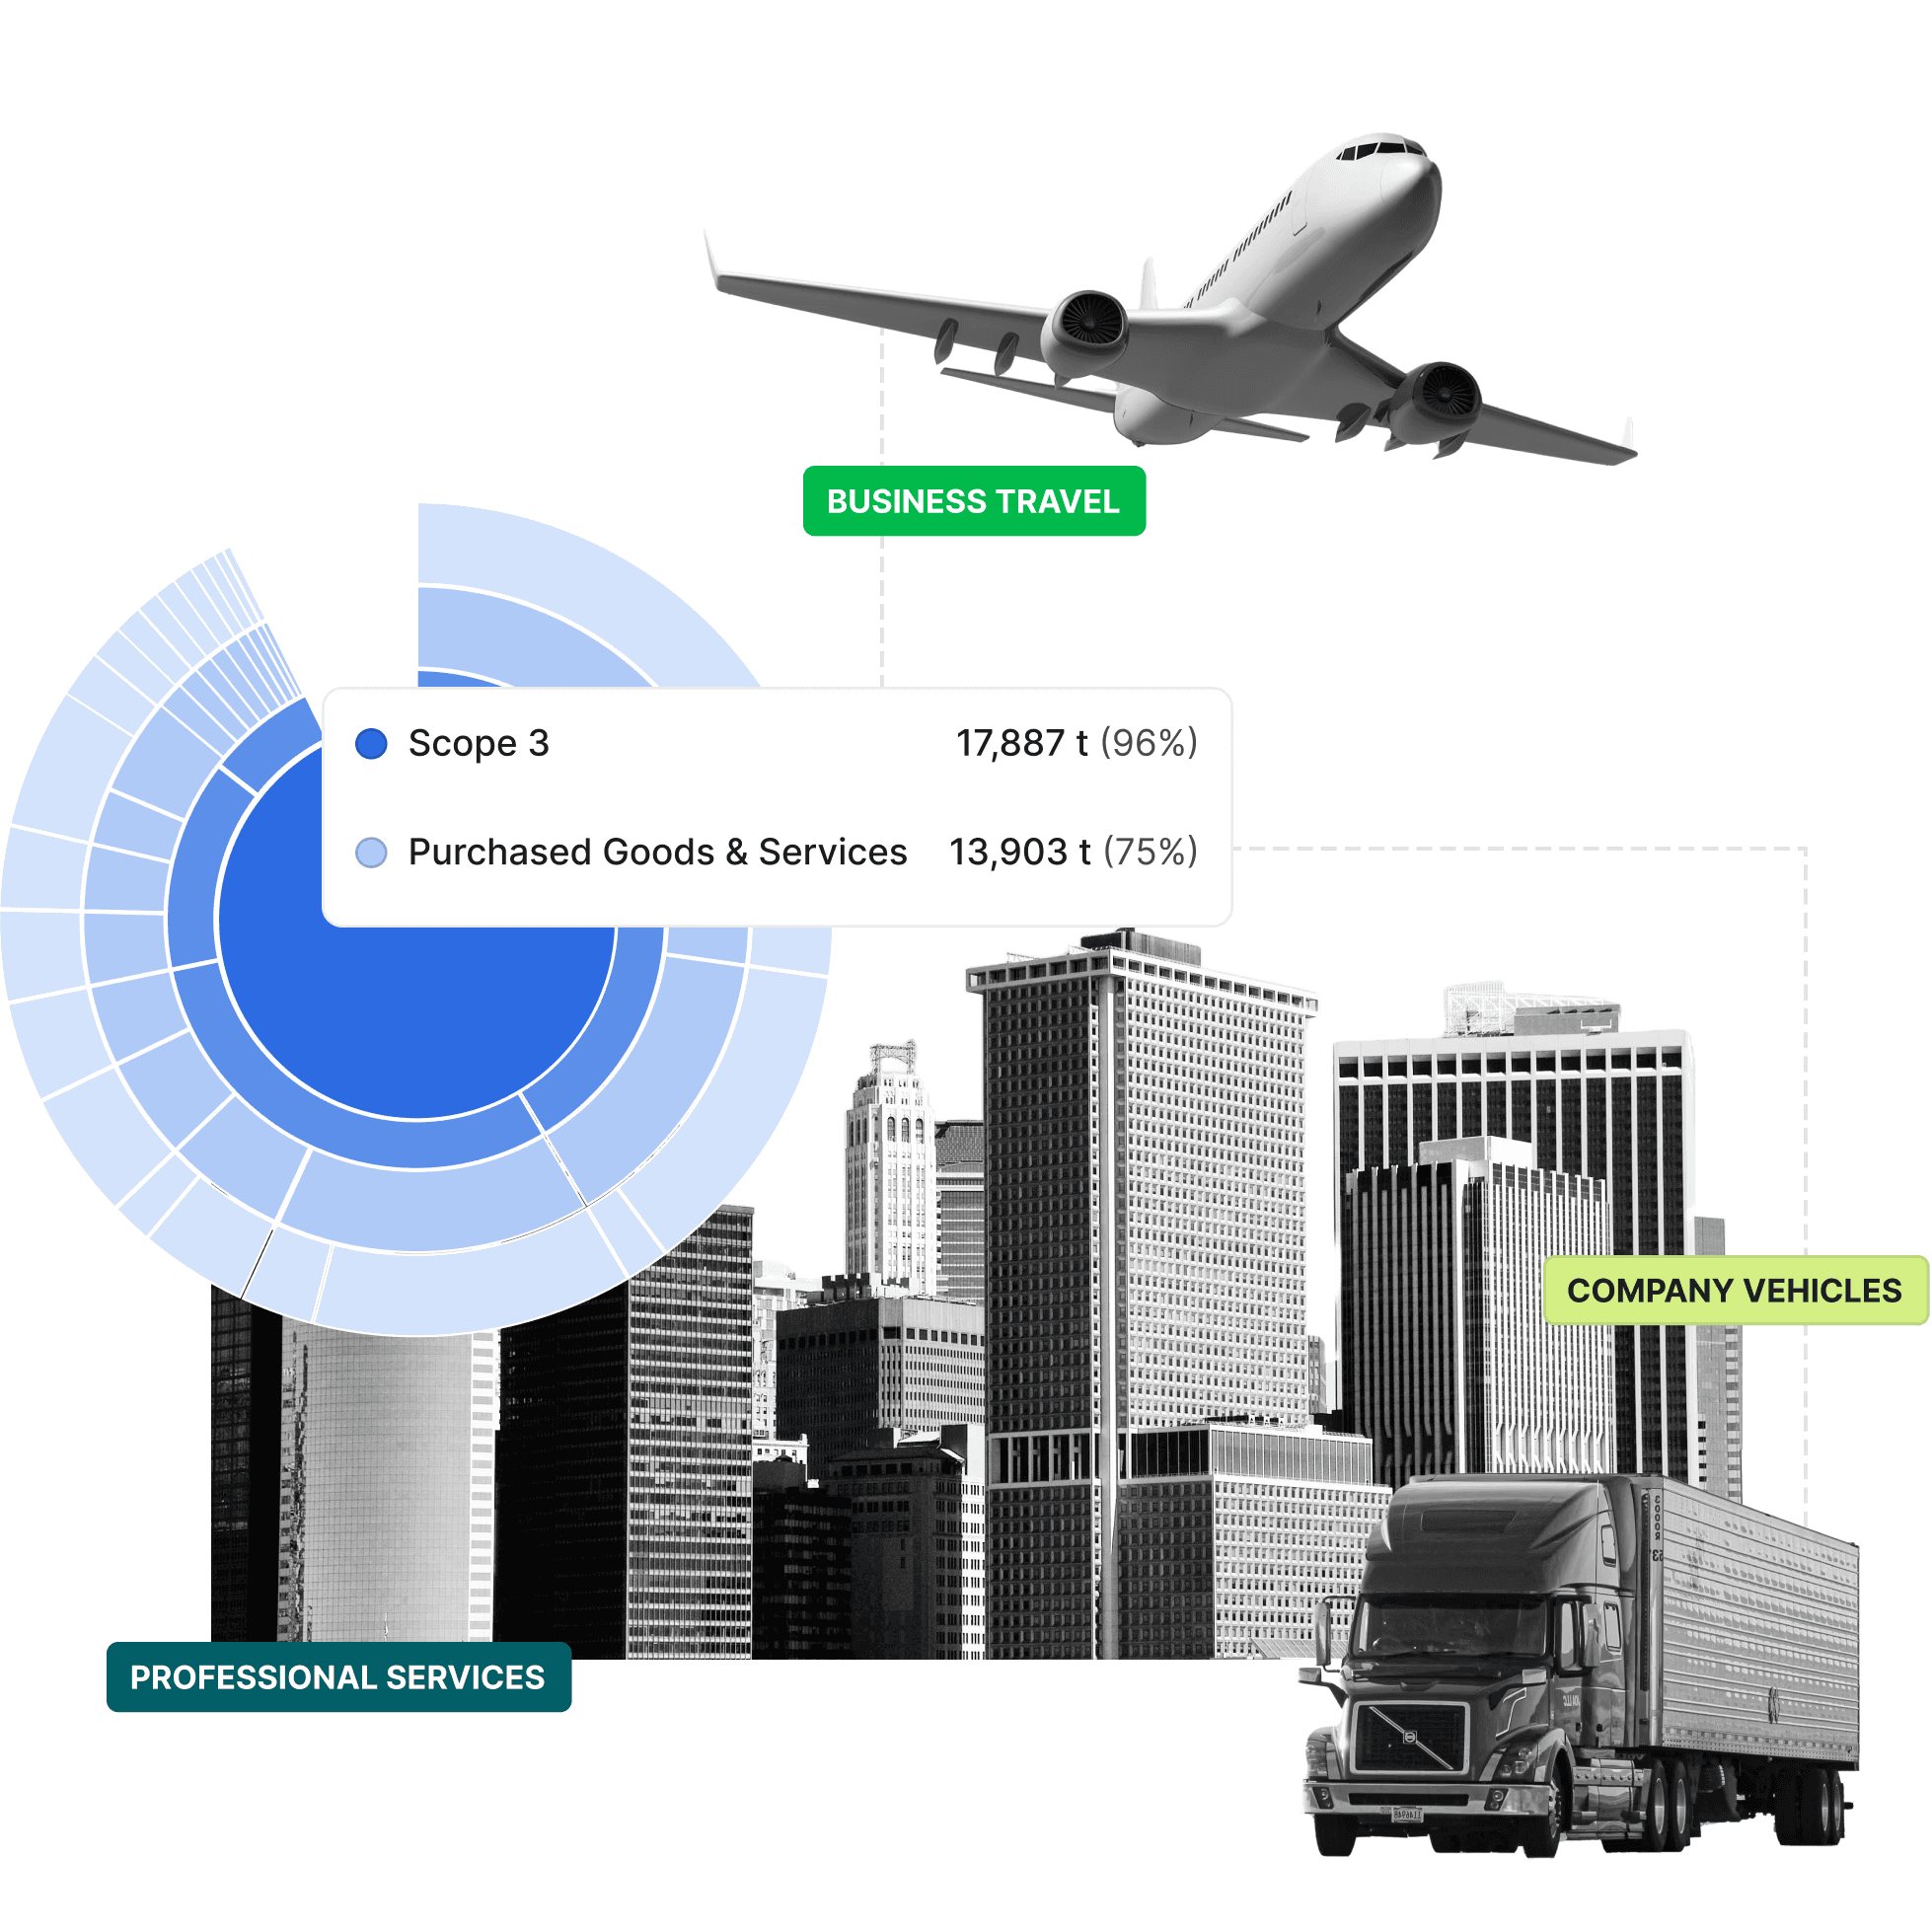
Science-based carbon accounting provides insights into key emissions hotspots across your value chain. Granular insights from your carbon footprint enables effective prioritization of decarbonization efforts, delivering the greatest impact and driving results toward your climate goals.
Learn how evo is leveraging good data to drive their decarbonization efforts ->


“The main barrier to driving climate action in finance is accurate carbon accounting data. Carbon Direct provided us with that data, and the scientific expertise to analyze what that data meant for our foundation.”
“The main barrier to driving climate action in finance is accurate carbon accounting data. Carbon Direct provided us with that data, and the scientific expertise to analyze what that data meant for our foundation.”
Kathleen Simpson, CEO
The Russell Family Foundation
Kathleen Simpson, CEO
The Russell Family Foundation

What is Carbon Direct’s approach to carbon accounting?
Effective enterprise carbon accounting requires a thorough understanding of your organization’s operations, value chains, and growth plans. We combine scientific expertise with technology to get your carbon accounting data right so you can drive meaningful climate action.
Operational emissions
Carbon Direct integrates the expertise of world-leading climate scientists directly into our platform, aligning your carbon measurement with the GHG Protocol and cutting-edge science. Our team delivers the tools and insights you need to take climate action with confidence. Tailored support is provided at every step of the carbon accounting process.
Financed emissions
Our team of industry experts specializes in asset-level measurement and decarbonization as part of a larger financed emissions strategy. Our team works closely with asset owners and asset managers to measure the carbon emissions of private holdings.
Supply chain emissions
Our industry experts map your supply chain to identify emissions hotspots. We help you prioritize key opportunities for supplier engagement and emissions reductions. Our team provides tailored guidance and builds capacity to support your suppliers through the data collection process, enhancing data harmonization.
Product carbon footprints and life cycle assessments
Our team provides insights into your products through life cycle assessments (LCAs) and product carbon footprints. Our team helps you comply with the latest regulations and ISO 14067, and helps you unlock additional decarbonization opportunities within your products’ life cycles.
Aviation contrails emissions
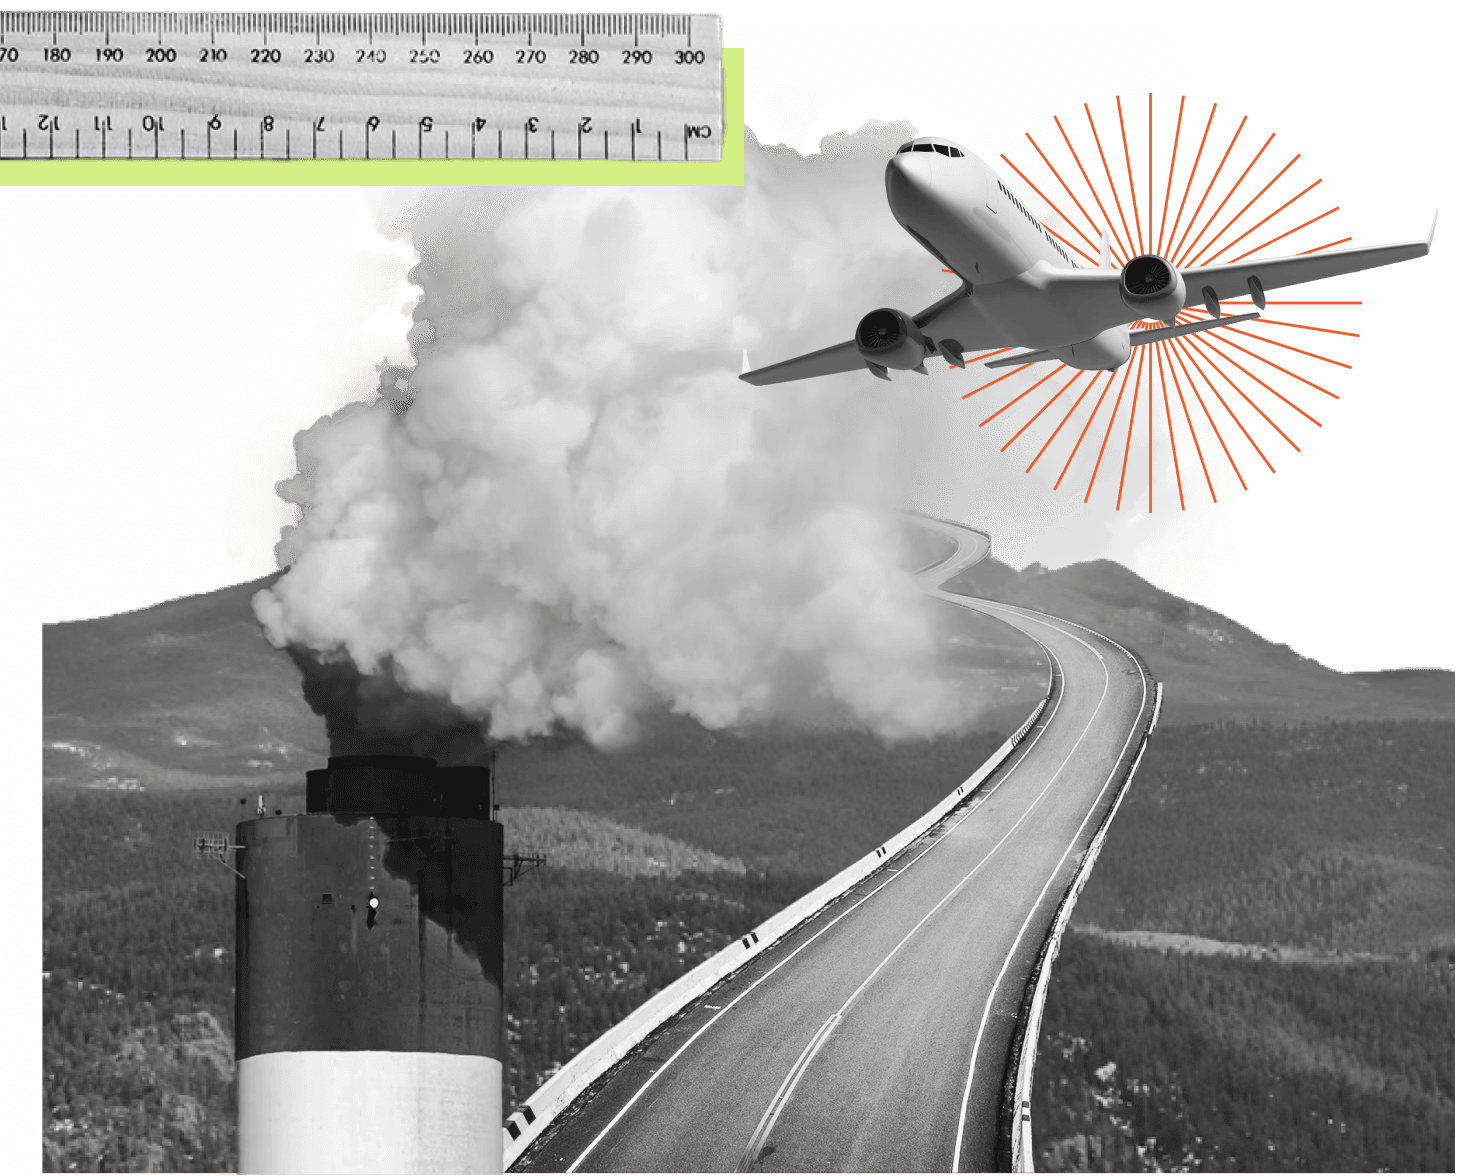
Carbon Direct is constantly updating our carbon accounting approach to reflect the most recent advances in climate science. Research has shown that aircraft contrails have a large climate impact, and our team has designed tools to measure contrails and suggest ways to minimize their effect.
Technology-driven carbon accounting support
Transparency, auditability, and harmonization of carbon accounting data are crucial to any credible net-zero strategy. Our carbon accounting software makes it easier and faster to get your climate data right by automating data ingestion and analysis, allowing for auditable data trails, improving accuracy, and helping you meet climate disclosure requirements. This is how our platform can help.
Leverage AI and APIs for smarter data collection
Customization to meet your needs
A single source of truth to unlock insights

Leverage AI and APIs for smarter data collection
Customization to meet your needs
A single source of truth to unlock insights

Leverage AI and APIs for smarter data collection
Customization to meet your needs
A single source of truth to unlock insights

Meet our experts
Carbon Direct’s team of climate science, policy, and carbon markets experts, coupled with our best-in-class platform, provide you with a unique blend of white-glove and technology-driven carbon accounting support.
Meet our experts
Carbon Direct’s team of climate science, policy, and carbon markets experts, coupled with our best-in-class platform, provide you with a unique blend of white-glove and technology-driven carbon accounting support.
Meet our experts
Carbon Direct’s team of climate science, policy, and carbon markets experts, coupled with our best-in-class platform, provide you with a unique blend of white-glove and technology-driven carbon accounting support.
What's next?
Set science-based targets based on your business’ carbon footprint
Once your carbon footprint is ready, the next step is developing science-based targets. Our team of experts guides you through the SBTi target setting process using our platform. We help you translate your climate ambitions—taking into account industry best practices and your organizational growth plans—into actionable emissions reduction targets that align with climate science.
Carbon measurement resources
Carbon measurement resources
Carbon measurement resources
Connect with an expert
Get answers to your decarbonization questions and explore carbon management solutions.
Connect with an expert
Get answers to your decarbonization questions and explore carbon management solutions.
Connect with an expert
Get answers to your decarbonization questions and explore carbon management solutions.


